Showing posts with label Education. Show all posts

Tuesday, February 27, 2018

More on Cost-Benefit in Education

Here's another example where the education establishment ignores cost-benefit analysis.

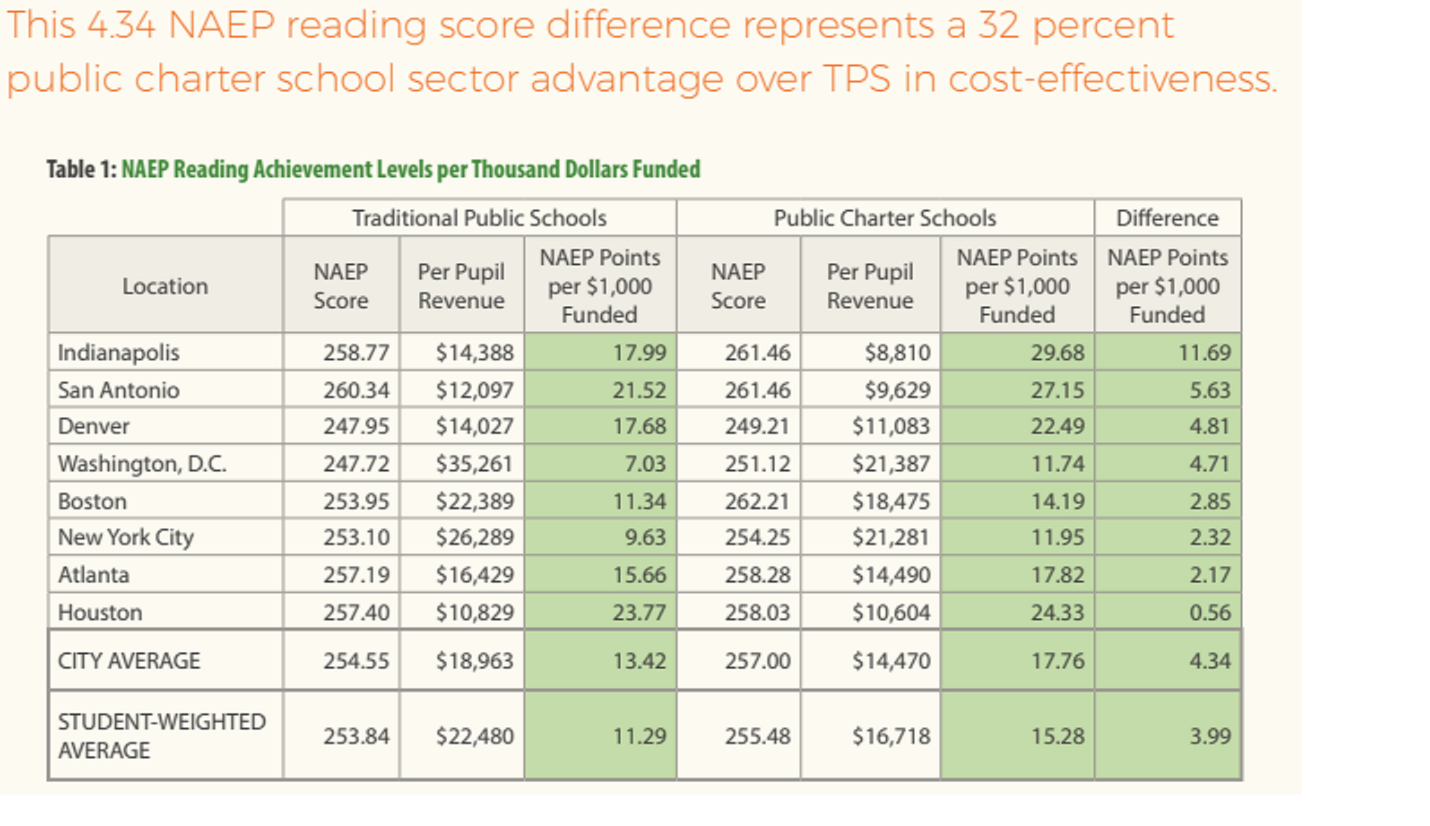
A new study from CATO and the University of Arkansas examines student performance at charter schools and traditional schools in eight major U.S. cities, Washington D.C., Indianapolis, Boston, Denver, San Antonio, New York City, Atlanta, and Houston. These researchers also conducted a return-on-investment (ROI) analysis, comparing projected lifetime earnings of charter school students with those of traditional school students, relative to the cost to taxpayers. Their conclusion? They show public charter schools are delivering better results for students at significantly lower costs to taxpayers.

Yet the education establishment routinely opposes charter schools. Not surprising if your objective has more to do with employing people than educating students. 
Monday, February 26, 2018

Education is Exempted From Cost-Benefit Analysis

Most people grasp the idea of cost-benefit analysis. for instance, you wouldn't spend $100,000 on improvements to your home if it added only $10,000 to the selling price. And you wouldn't spend a million dollars on advertising your business if it only increased sales by $100,000.

However, when it comes to education, people seem to be living in a different universe. They are spending huge amounts of money and getting no benefit from it. If your local supermarket doubled your grocery bill so they could hire more people, but gave you the same amount of food at the same service level, would you continue to do business with them? Of course not. What if government forced you to pay that store even if you went elsewhere to shop? They would have no incentive to stop spending money for no benefit, would they?


Monday, February 22, 2016

Government Control=Increasing Costs

Let's examine six fairly basic needs of human beings:

1. Clothing
2. Food
3. Shelter
4. Health care
5. Education

These are ranked in increasing order of the government's control and subsidy of their creation and delivery.

They are also ranked in the increasing order of inflation adjusted cost increases over the last fifty years.

Coincidence? When government subsidizes something, the cost will rise much faster. Which leads to cries for more government subsidy. That's a pretty neat scheme -- if you work in government. Not so much if you're paying for it as a taxpayer or consumer.


Tuesday, June 2, 2015

Income Inequality Is a Symptom, Not The Disease

Harvard  professor Robert Putnam has some revealing data in his book "Our Kids" that echoes the themes about which Charles Murray has been writing. Namely that America is becoming rigid. It is settling into immobile classes that don’t mix.  Not in neighborhoods, not in schools, not in marriage and not in work. 

The current fad is to focus on "Income Inequality". But this is focusing on the symptoms of a disease, not the disease itself.  It's akin to providing pain killers to cancer victims rather than chemo therapy . The disease is a growing class of people who, for a whole host of reasons other than not having much money, engage in adverse behaviors. Worse, they "infect" their children with those behaviors, as the two charts below demonstrate. 

AA figured this out out a long time ago. You can cite a dozen reasons why you're an alcoholic (including bad genes from your parents), but you can't stop being one until you take some personal responsibility for your condition. 


Monday, December 17, 2012

Where The Jobs Aren't

According to employment forecasts from the BLS here are the 30 occupations that are expected to experience the largest job growth between 2010 and 2020. Only 5 of them require a college degree or higher while half require a high school degree. Yet we are encouraging more and more of our young people to borrow huge sums to get higher educational credentials while allowing more and more to fail to obtain a high school diploma. Only government could take its own market research and construct policies exactly opposite to what that research suggests.

Rank Occupation Entry-Level Education Jobs in 2010 (1,000s) Jobs in 2020 (1,000s) Increase (1,000s)
1 Registered Nurses BA 2,737.4 3,449.3 711.9
2 Retail Salespersons Less than HS 4,261.6 4,968.4 706.8
3 Home Health Aides Less than HS 1,017.7 1,723.9 706.3
4 Personal Care Aides Less than HS 861.0 1,468.0 607.0
5 Office Clerks, General High School 2,950.7 3,440.2 489.5
6 Combined Food Preparation and Serving Workers, Including Fast Food Less than HS 2,682.1 3,080.1 398.0
7 Customer Service Representatives High School 2,187.3 2,525.6 338.4
8 Heavy and Tractor-Trailer Truck Drivers High School 1,604.8 1,934.9 330.1
9 Laborers and Freight, Stock, and Material Movers, Hand Less than HS 2,068.2 2,387.3 319.1
10 Postsecondary Teachers Doctoral 1,756.0 2,061.7 305.7
11 Nursing Aides, Orderlies, and Attendants High School 1,505.3 1,807.2 302.0
12 Childcare Workers High School 1,282.3 1,544.3 262.0
13 Bookkeeping, Accounting, and Auditing Clerks High School 1,898.3 2,157.4 259.0
14 Cashiers Less than HS 3,362.6 3,612.8 250.2
15 Elementary School Teachers, Except Special Education BA 1,476.5 1,725.3 248.8
16 Receptionists and Information Clerks High School 1,048.5 1,297.0 248.5
17 Janitors and Cleaners, Except Maids and Housekeeping Cleaners Less than HS 2,310.4 2,556.8 246.4
18 Landscaping and Groundskeeping Workers Less than HS 1,151.5 1,392.3 240.8
19 Sales Representatives, Wholesale and Manufacturing High School 1,430.0 1,653.4 223.4
20 Construction Laborers Less than HS 998.8 1,211.2 212.4
21 Medical Secretaries High School 508.7 718.9 210.2
22 Supervisors of Office and Administrative Support Workers High School 1,424.4 1,627.8 203.4
23 Carpenters High School 1,001.7 1,197.6 196.0
24 Waiters and Waitresses Less than HS 2,260.3 2,456.2 195.9
25 Security Guards High School 1,035.7 1,230.7 195.0
26 Teacher Assistants High School 1,288.3 1,479.3 191.1
27 Accountants and Auditors BA 1,216.9 1,407.6 190.7
28 Licensed Practical and Licensed Vocational Nurses High School 752.3 920.8 168.5
29 Physicians and Surgeons Doctoral 691.0 859.3 168.3
30 Medical Assistants High School 527.6 690.4 162.9

Monday, December 3, 2012

Tution Bubble

You may recall the housing bubble where the rise in cost of housing greatly outstripped the rise in the public's average income that is necessary to support the purchase of that asset? Pop! What do you think is going to happen here? In both cases the government was/is driving inflation of the underlying asset price via loan subsidies. In the case of housing, you can discharge your debt by allowing the lender to foreclose. What do you do with your education loans when you discover you are not generating the income to service the debt? If the recent election is any guide, you ask the gainfully employed taxpayers who didn't borrow irresponsibly to bail you out. This is now The American Way.


Tuesday, May 8, 2012

Would You Buy This Product?

Would you continue to buy a service where the cost kept going up and up and the value you received for it did not?


What if the service provider told you that costs were rising because he needed to hire more and more people to serve the same number of customers every year?

Monday, April 23, 2012

The Bad Mechanics of Education

Imagine you have a car that can't go over 20 mph, leaks oil, lurches left at every corner. Your mechanic has been working on it for years. Nothing changes -- except that he tells you to pour more and more money into the car. At what point do you conclude that whatever that mechanic is doing is not going to get you a high performing automobile?

Education is getting like that. We continue to pour money into the same vehicle and the same mechanics on the assumption that the solution involves spending more on the same things that aren't producing the results we need. Richard Arum (NYU) and Josipa Roksa (UVA) wrote a book entitled Academically Adrift in which they documented that


"45 percent of students (do) not demonstrate any statistically significant improvement in Collegiate Learning Assessment [CLA] performance during the first two years of college. [Further study has indicated that 36 percent of students did not show any significant improvement over four years.]"

Why would this be? They also discovered that less than half of undergraduates had taken a single course the previous semester that required 20 pages of written work. A third had not taken a single course that required 40 pages of reading.  In other words, they discovered that colleges that demand little effort are getting little results. Are you surprised? More importantly does this lead to a (rational) conclusion that you ought to give the people running these institutions more of your money? The education business has simply become a scam that dupes those who are themselves too lazy or uneducated to inquire into whether they are really getting anything in return for their investment. It's time to hire new mechanics or get a new car.