Monday, April 13, 2015
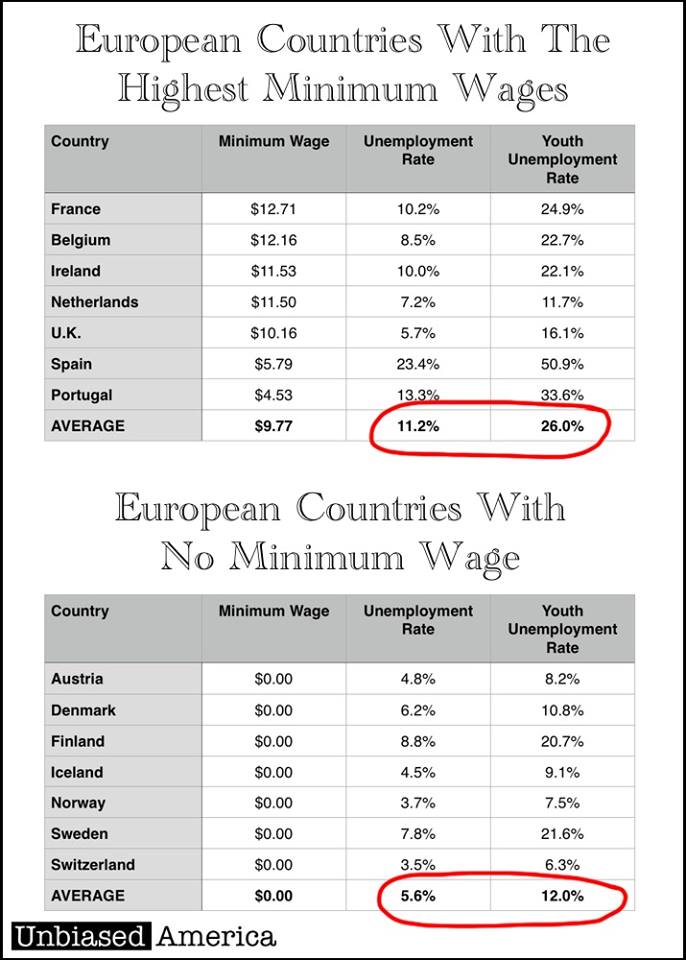
Minimum Wages Laws=Greater Unemployment
Courtesy of Mark Perry comes this table contrasting the unemployment rates in European countries with statutory minimum wages versus those without such constraints. Just further evidence that the true goal of minimum wage advocates is not jobs, but to prevent wage competition from younger, less skilled workers. As the song goes, "Nice work . . . if you can get it."


Sunday, March 15, 2015
Global Debts Keeps Piling Up
Debt is a tricky thing. If it's used productively (e.g. to finance purchase of cash generating equipment or an advanced degree that will land a high paying job) it can be growth accelerator. If it's used carelessly (e.g. to finance a vacation or to enable someone not to work) it can have disastrous consequences. In the last 15 years worldwide debt has more than doubled. Is it financing productivity? Or indulgence?

Thursday, February 26, 2015
Why Bashing High Income Earners May Not Resonate So Well
Mark Perry points out why bashing high earners may not be getting as much traction with the public as Democrats would like.

Why China Grows Faster Than The US
One continues to hear a lot of China bashing. They compete "unfairly". American companies are "shipping jobs" to China. What you seldom hear is a discussion of the comparative economic incentives in China versus the US. The fact is, government in China has created a much more friendly place to work and produce than in the US. The US heavily taxes economic success. China does not. Wonder why Chinese businessmen no longer come to the US to set up their businesses? Look at the table below.
China United States
Capital Gains Taxes 0 20-45%
Property Taxes 0 Substantial
State and Local Taxes 0 10-20%
Top Federal Income Tax Rate 35% 43%
Corporate Tax Rate 15% 39%
Inheritance Tax 0 55%
Also consider that this China is not the casino economy the US is where everyone is playing with borrowed money.
Min. Home Loan Down Payment 30% 3%
% Vehicles Purchased on Credit 7% >50%
China United States
Capital Gains Taxes 0 20-45%
Property Taxes 0 Substantial
State and Local Taxes 0 10-20%
Top Federal Income Tax Rate 35% 43%
Corporate Tax Rate 15% 39%
Inheritance Tax 0 55%
Also consider that this China is not the casino economy the US is where everyone is playing with borrowed money.
Min. Home Loan Down Payment 30% 3%
% Vehicles Purchased on Credit 7% >50%
Now, you might still rather live in the US for non-economic reasons. China has a one-party government that can punish people it doesn't like (of course, as we have seen, the IRS behaves that way in the US). But what China has done is create the sort of economic climate that used to exist in the US. One where people were strongly incented to produce. One where people could keep most of what they produced instead of handing it over to government. The result is clear:
GDP Growth Rate 10% 2%
Thursday, February 5, 2015
Best Income Equalizer? Cheap Fuel.
Democrats are always posturing that they seek to "help the poor", but actions speak much more than those words. If Democrats really want to help the lower income population, cheap energy would be the place to start. Instead they fight fracking. They fight pipelines. They fight gas production. They promote and impose expensive energy sources like solar power. The wealthy can afford to pay for boutique energy.


Wednesday, February 4, 2015
If Grocery Stores Were Run Like K-12 Schools
Don Bourdreaux makes the point about the absurdity of the monopoly K-12 education by imaging what the grocery industry would look like if it were run the same way.
News reports would regularly include stories of “grocery experts” offering new and “pioneering” proposals to improve grocery distribution, and of the citizens of “grocery districts” meeting with their local “grocery boards” to discuss and debate these different proposals. ”Professors of Groceries” in all the top “Schools of Groceries” across the land would debate with each other and with the public the whys and why-nots of the failure of the latest scheme to make America again #1 in international measures of grocery distribution. Newspapers of record would regularly feature headline reports on the “grocery crisis.”
Ordinary men and women – physicians, electricians, cab drivers, auto mechanics, professors of economics, web designers, kennel owners, carpenters – almost none of whom have the slightest bit of expertise or experience to qualify them to assess the different methods proposed to deliver groceries, would nevertheless be expected to have such an opinion, and they would be applauded if and when they attend the next meeting of the “Grocery Board” to express their opinions on how best to supply groceries.
Anyone proposing to get government out of the grocery-supply business would, of course, be ridiculed as being totally unrealistic or being an out-of-touch ideologue, or accused of harboring a secret desire to see the the vast majority of people starve while only the top one percent of the population continues to enjoy excellent access to superb groceries.
Read the whole thing here http://cafehayek.com/2015/01/if-groceries-were-supplied-like-k-12-education.html
News reports would regularly include stories of “grocery experts” offering new and “pioneering” proposals to improve grocery distribution, and of the citizens of “grocery districts” meeting with their local “grocery boards” to discuss and debate these different proposals. ”Professors of Groceries” in all the top “Schools of Groceries” across the land would debate with each other and with the public the whys and why-nots of the failure of the latest scheme to make America again #1 in international measures of grocery distribution. Newspapers of record would regularly feature headline reports on the “grocery crisis.”
Ordinary men and women – physicians, electricians, cab drivers, auto mechanics, professors of economics, web designers, kennel owners, carpenters – almost none of whom have the slightest bit of expertise or experience to qualify them to assess the different methods proposed to deliver groceries, would nevertheless be expected to have such an opinion, and they would be applauded if and when they attend the next meeting of the “Grocery Board” to express their opinions on how best to supply groceries.
Anyone proposing to get government out of the grocery-supply business would, of course, be ridiculed as being totally unrealistic or being an out-of-touch ideologue, or accused of harboring a secret desire to see the the vast majority of people starve while only the top one percent of the population continues to enjoy excellent access to superb groceries.
Read the whole thing here http://cafehayek.com/2015/01/if-groceries-were-supplied-like-k-12-education.html
Thursday, January 22, 2015
You Can Keep Your Wealth (NOT)
In his State of the Union Message, President Obama said the following:
And let’s close the loopholes that lead to inequality by allowing the top one percent to avoid paying taxes on their accumulated wealth. We can use that money to help more families pay for childcare and send their kids to college.
This is an utterly bizarre statement any way you cut it. It was lifted from the transcript, so it was not a mistake he made orally.
First of all, there are no taxes on accumulated wealth. There are taxes on income that wealth may produce, but if you put your wealth into a checking account that pays zero interest, there are no taxes on it. This is not a "loophole"in the tax law. It is the tax law.
Secondly, "loopholes" (even if they existed) do not produce inequality. What causes economic inequality are disparities in the ability to produce things of value for which others pay you. Inequality of skills and abilities has been the rule since recorded time. Yet the President thinks that inequality of wealth comes from something that the government does?
Thirdly,"we" can use that money? That is, that money you earned (after taxes) does not belong to you. Therefore it something that "we" can use for things that "we" feel like.
This is a very scary man who is not well connected to reality who mouths discredited Communist manifestos as if they were obvious givens.
Household Income Has Fallen. People's Income May Not Have
This chart appeared in an article in the Wall Street Journal today. What it shows is actually true. The implications that the WSJ writer derives from it are not. Those not statistically literate (which is to say 95% of the population and 99% of journalists) would look at this chart and conclude that people are earning less now than in 2000.

A statistician would look at this and ask the question, "I wonder if the composition of households has changed since 2000?" It has.

The number of people per household who are actually earning an income has dropped quite a bit since 2000. Here's a simple example. Suppose you live in a neighborhood of 20 households. The median income per household is $70,000. The husband and wife in one household separate. Now there are 21 households in that neighborhood that, collectively, are earning exactly the same amount of money as they were before. The median income of that neighborhood has dropped, although nothing else as changed,.
It's important (even for journalists) that in examining data that you at least ask the question, "what else might be going on here?" before you leap to a conclusion.
A statistician would look at this and ask the question, "I wonder if the composition of households has changed since 2000?" It has.
The number of people per household who are actually earning an income has dropped quite a bit since 2000. Here's a simple example. Suppose you live in a neighborhood of 20 households. The median income per household is $70,000. The husband and wife in one household separate. Now there are 21 households in that neighborhood that, collectively, are earning exactly the same amount of money as they were before. The median income of that neighborhood has dropped, although nothing else as changed,.
It's important (even for journalists) that in examining data that you at least ask the question, "what else might be going on here?" before you leap to a conclusion.
Wednesday, January 21, 2015
Creating Jobs By Making Workers More Expensive to Hire
In the Bizarro World in which the President lives, the way you create more jobs for low-wage workers is to increase the cost to employers of hiring them. In no other universe do people spend more on something as the cost goes up.

Tuesday, January 20, 2015
The Queuing Economy in Venezuela
Hugo Chavez and his socialist successors in Venezuela have indeed created jobs for lower skilled workers there. You can now be employed as a "queue worker". A queue worker is someone who gets paid to stand in line to purchase basic items -- such as mile, sugar, diapers, shampoo -- that are in short supply due to government economic policies. Read the article here. It's a little hard to see how you could build a vibrant economy based on paying others to stand in line, but apparently the Venezuelan government is determined to try.
Sunday, January 18, 2015
The Income Tax is More Skewed Than Ever
President Obama announced that in his State of the Union Message he would propose to raise income taxes on The Rich. This announcement came in the same week that the IRS published new data for 2012 that show that income taxes are more skewed than ever before. Now we know facts and analysis are not the President's strong suit, but wasn't there anyone on his staff who could read charts for him? Or maybe it's the same staff that told him that Obamacare would reduce healthcare costs by $2500 per year? Or (more likely) the President just doesn't care much about the truth.

Wednesday, January 14, 2015
Why Government Continues to be "Floppy"
An article in The NY Times describes the efforts of Megan Smith to bring technology practices in the White House into the 21st century (they still use floppy disks there for example).
My prediction is that Ms. Smith will largely fail. Large, stodgy companies may be somewhat slower to adopt technology than those in Silicon Valley, but they do so at lightning speed compared to government. They don't do it to be "cool". They do it because it makes them more efficient. They do it because they are competing against other companies. They do it because it is profitable. None of these drivers are at play in government.
Instead, what drives government are political considerations that are often counterproductive. Exhibit A. In this article we learn that Ms. Smith is greatly concerned about what? Recruiting more female technologists. Can someone (Ms. Smith?) please explain why if the primary objective were to introduce technology for greater efficiency it would make one iota of difference what chromosomes are possessed by those designing the systems and writing the code? No doubt there will also be a push to recruit black technologists, Hispanic technologists and homosexual technologists. All of whom will continue to use floppy disks.
My prediction is that Ms. Smith will largely fail. Large, stodgy companies may be somewhat slower to adopt technology than those in Silicon Valley, but they do so at lightning speed compared to government. They don't do it to be "cool". They do it because it makes them more efficient. They do it because they are competing against other companies. They do it because it is profitable. None of these drivers are at play in government.
Instead, what drives government are political considerations that are often counterproductive. Exhibit A. In this article we learn that Ms. Smith is greatly concerned about what? Recruiting more female technologists. Can someone (Ms. Smith?) please explain why if the primary objective were to introduce technology for greater efficiency it would make one iota of difference what chromosomes are possessed by those designing the systems and writing the code? No doubt there will also be a push to recruit black technologists, Hispanic technologists and homosexual technologists. All of whom will continue to use floppy disks.
Tuesday, December 30, 2014
If Everyone Spent Like the Government
If you're having trouble relating to the huge numbers involved in government budgets, this chart might put it in perspective. The only thing that's misleading about this is that no lender would increase your credit line every year if you had $300,000 in unsecured debt. They would tell you to be responsible with your spending and learn to live within your means.

Tuesday, December 23, 2014
Why It's Not Realistic to "Grow Your Way Out of Debt"
You've heard it said often. It also seems to be the premise of the Federal Reserve's "quantitative easing". Debt is not all that onerous if you can grow your way out of it. This is actually a true statement. But is this a plan for the US economy or just a wish?
Total debt in the US -- government, corporate and private -- is $58 trillion.
Total GDP in the US is $18 trillion, but $6 of that is government spending -- taking money from the production of the private sector and spending it on non-productive activities like transfer payments to Social Security and Medicare. So the part of the economy that actually produces value is about $12 trillion.
Total debt in the US -- government, corporate and private -- is $58 trillion.
Total GDP in the US is $18 trillion, but $6 of that is government spending -- taking money from the production of the private sector and spending it on non-productive activities like transfer payments to Social Security and Medicare. So the part of the economy that actually produces value is about $12 trillion.
Assuming an annual interest of 2%, even if you could
restrain annual debt increases to 3% of GDP a year, the productive part of the economy
would have to grow at 5% just to stay even. When was the last time you saw the economy grow that fast for more than a quarter?
Now imagine that interest rates jumped to, say, 5% (the ten year treasury was at 5% in 2002). At that level almost a quarter of private sector GDP would have to be devoted to debt service to break even. Hardly likely. So it's pretty easy to see why the Federal Reserve keeps backing off its promise to reduce its funding and allow interest rates to rise. Where (and how) does all this end?
Friday, November 28, 2014
High Earners Part II
In my previous post, I referenced the IRS report on high earning Americans. Not only are the top 400 earners ephemeral (almost all of them won't be Top 400 earners more than once), but they also account for a huge amount of the income tax collected by the IRS.
Tax year 2010
Earners Number of Filers Tax Paid
Top 400 400 $19.1B
Bottom 50% 67.5 million $22.4B
In other words, 400 (not 400 thousand) tax filers pay about the same amount of tax as $68 MILLION people who earn the least (and of course, there are millions more that didn't have enough income to file).
So when someone contends that the Super Rich are not paying their fair share . . . . What would that fair share be?
Tax year 2010
Earners Number of Filers Tax Paid
Top 400 400 $19.1B
Bottom 50% 67.5 million $22.4B
In other words, 400 (not 400 thousand) tax filers pay about the same amount of tax as $68 MILLION people who earn the least (and of course, there are millions more that didn't have enough income to file).
So when someone contends that the Super Rich are not paying their fair share . . . . What would that fair share be?
Tuesday, November 25, 2014
High Earners: Here Today, Gone Tomorrow
If you want to lash out at the the vile "high earners" in The United States, you'd better act quickly. The IRS just released a new report on the 400 taxpayers reporting the highest adjusted gross incomes (AGI) from 1992 to 2010. Of the 7,600 tax returns filed from 1992 to 2010 (400 highest earners in each year x 19 years), there were 4,024 unique, individual taxpayers. Of the group of 4,024 top earners from 1992-2010, there were 2,909 individuals taxpayers who made it into the “Fortunate 400″ only one time during the 19-year period.


Wednesday, November 19, 2014
20% of Households Bear 100% of Net Tax Burden
We have already covered the fact that 20% of US households pay 94% of Federal income taxes. The Congressional Budget Office's latest report "The Distribution of Household Income and
Federal Taxes" provides new insight into how the burdens of taxation and the distribution of government payments fall. Mark Perry created this useful summary chart from that data. What it shows is that the entire net burden of the government taxation and redistribution machine falls on the 20% of households with the highest market income (roughly $80,000+ of Adjusted Gross Income) and that 60% of households are net recipients of government monies. But according to the President that top quintile of earners just isn't paying their "fair share".

Note: Transfer payments are payments and benefits from federal, state and local governments including Social Security, Medicare and unemployment insurance., Federal taxes paid by households include income, payroll, corporate, and excise taxes.
Federal Taxes" provides new insight into how the burdens of taxation and the distribution of government payments fall. Mark Perry created this useful summary chart from that data. What it shows is that the entire net burden of the government taxation and redistribution machine falls on the 20% of households with the highest market income (roughly $80,000+ of Adjusted Gross Income) and that 60% of households are net recipients of government monies. But according to the President that top quintile of earners just isn't paying their "fair share".
Note: Transfer payments are payments and benefits from federal, state and local governments including Social Security, Medicare and unemployment insurance., Federal taxes paid by households include income, payroll, corporate, and excise taxes.
Friday, October 31, 2014
It's All George Bush's Fault
The New York Times has often reflexively lent its voice to the chorus of "It's All George Bush's Fault". The editors probably missed the irony when they published this article pointing out that falling oil and gas prices are a direct result of actions taken by the reviled Bush-Cheney administration.
The Bush administration worked from the start on finding ways to unlock the nation’s energy reserves and reverse decades of declining output, with Mr. Cheney leading a White House energy task force that met in secret with top oil executives.
“Ramping up production was a high priority,” said Gale Norton, a member of the task force and the secretary of the Interior at the time. “We hated being at the mercy of other countries, and we were determined to change that.”
The task force’s work helped produce the Energy Policy Act of 2005, which set rules that contributed to the current surge. It prohibited the Environmental Protection Agency from regulating fracking under the Safe Drinking Water Act, eliminating a potential impediment to wide use of the technique. The legislation also offered the industry billions of dollars in new tax breaks to help independent producers recoup some drilling costs even when a well came up dry.
Separately, the Interior Department was granted the power to issue drilling permits on millions of acres of federal lands without extensive environmental impact studies for individual projects, addressing industry complaints about the glacial pace of approvals. That new power has been used at least 8,400 times, mostly in Wyoming, Utah and New Mexico, representing a quarter of all permits issued on federal land in the last six federal fiscal years.
The Bush administration also opened large swaths of the Gulf of Mexico and the waters off Alaska to exploration, granting lease deals that required companies to pay only a tiny share of their profits to the government.
These measures primed the pump for the burst in drilling that began once oil prices started rising sharply in 2005 and 2006. — The New York Times
Wednesday, October 22, 2014
Job Creation is All in Texas
The President has recently taken to touting his "job creation" performance by pointing out that in the last six years, the US economy has created over 300,000 new jobs. Not particularly good, but it allows the President to suggest that his policies have had a positive effect. But as it turns out, the job growth has all been in one state -- Texas.
US job growth +327,000
Texas job growth +1,320, 255
US (other than Texas) - 993,255
But for Texas, the US would have lost almost a million jobs! And why did Texas add so many jobs?
1. Fossil fuels extraction
2. Lower taxes
3. Less regulation
4. Right-to-work laws
All things that the President opposes.
Sort of casts a different light on the claim that the President policies can create any jobs in the future.
US job growth +327,000
Texas job growth +1,320, 255
US (other than Texas) - 993,255
But for Texas, the US would have lost almost a million jobs! And why did Texas add so many jobs?
1. Fossil fuels extraction
2. Lower taxes
3. Less regulation
4. Right-to-work laws
All things that the President opposes.
Sort of casts a different light on the claim that the President policies can create any jobs in the future.
Friday, October 3, 2014
The Unemployment Rate Does not Measure Labor Market Vitality
Despite what you will hear out of Washington, there is really only one reason that the reported unemployment rate keeps dropping. Each month there are fewer people actually participating in the workforce. The unemployment number you see reported each month is the percentage of the people in the workforce who are unemployed. When the denominator of that ratio drops, the unemployment number drops even though there may be no more people actually employed.
You will sometimes hear that the drop in labor force participation is due to more people taking normal retirement. This may be happening, but take a look at the chart below. Do you think the normal retirement rate suddenly accelerated starting in 2007?
The number of people not working increased by 315,000 this month to a record 92.6 million. Anyway you cut it, that's not good. Fewer people working -- for whatever reason -- means fewer people producing things and (in general) less money to spend buying things. There is no way that the US economy can have robust growth when fewer people are working each money,

You will sometimes hear that the drop in labor force participation is due to more people taking normal retirement. This may be happening, but take a look at the chart below. Do you think the normal retirement rate suddenly accelerated starting in 2007?
The number of people not working increased by 315,000 this month to a record 92.6 million. Anyway you cut it, that's not good. Fewer people working -- for whatever reason -- means fewer people producing things and (in general) less money to spend buying things. There is no way that the US economy can have robust growth when fewer people are working each money,
Subscribe to:
Posts (Atom)